Staging statistics circulate widely and are rarely sourced. This piece collects the main figures, identifies where each comes from, and flags how much weight each deserves.
The short version: staging's effect on speed and engagement is well supported. Its effect on price is real but smaller than most industry claims suggest.
How to Read Staging Data
Before the numbers, a note on sources.
National Association of Realtors (NAR) surveys agents broadly — buyer's agents and seller's agents, whether or not they use staging. Largest sample, least incentive to overstate. Most reliable source available.
Real Estate Staging Association (RESA) surveys professional stagers about properties they staged. Useful for industry benchmarks, but the sample is self-selecting and the incentive is obvious.
Staging companies and tool vendors publish figures in marketing material. Many trace circularly back to other marketing material rather than to primary research.
Throughout this piece, figures are tagged with their source so you can weight them yourself.
Try DecoAI Free
3 free credits. No credit card needed. Stage any room in 30 seconds.
Get 3 Free CreditsDays on Market
The Headline Figures
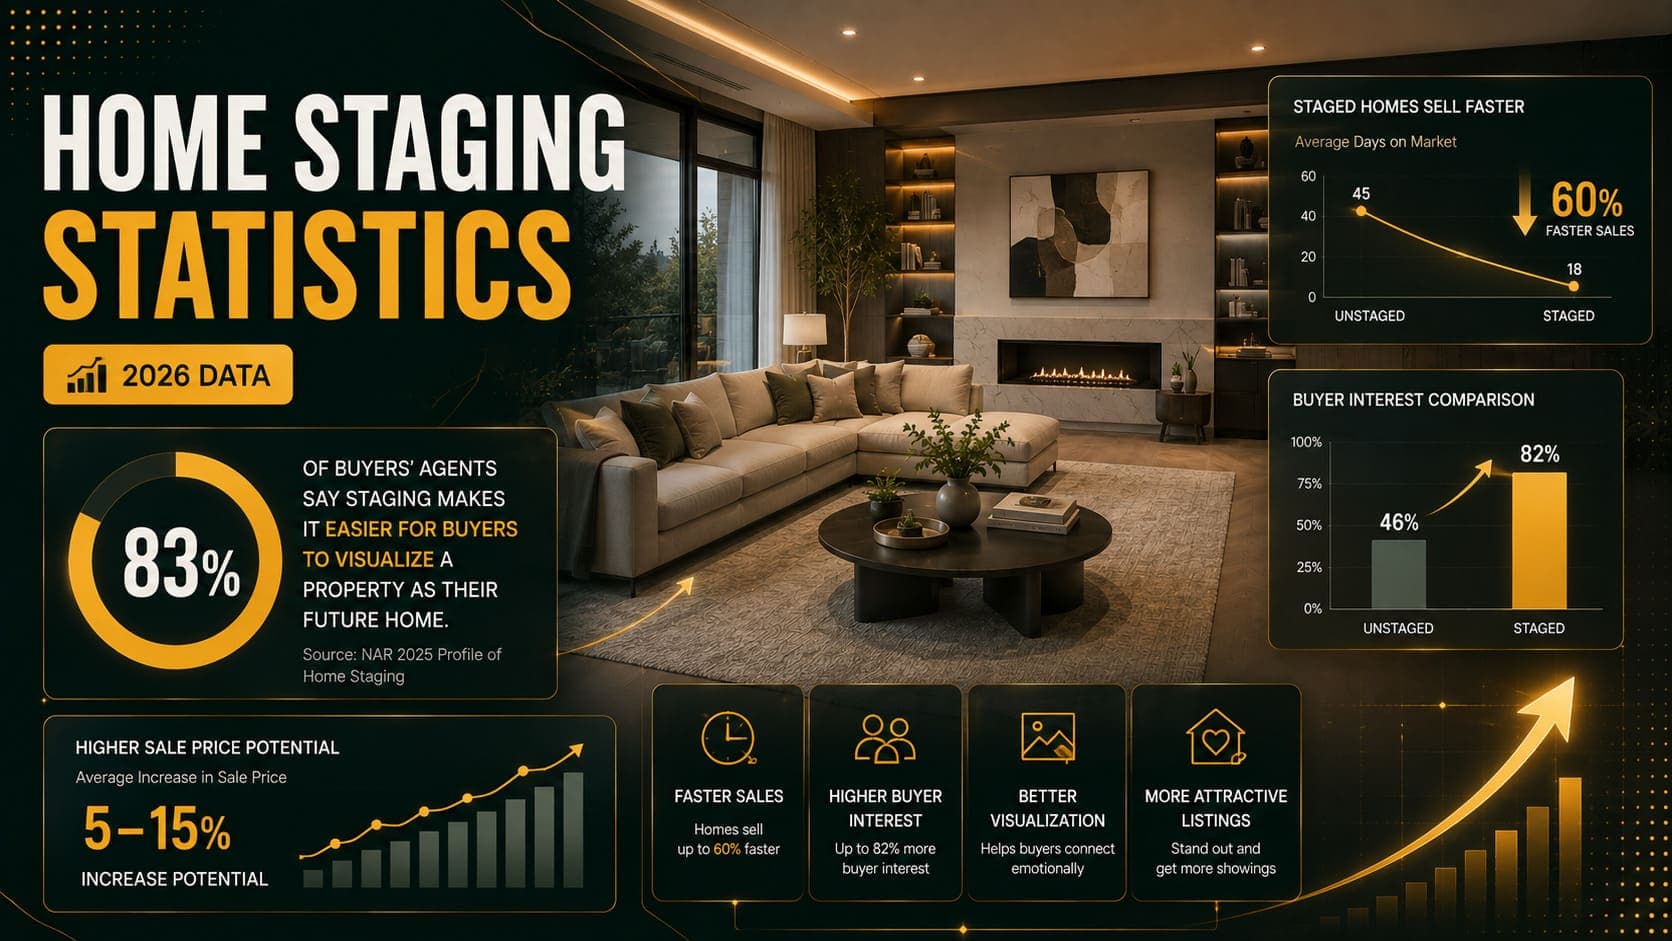
Staged homes sell 73% faster than unstaged homes Source: Industry aggregate, widely cited, original methodology unclear
Staged listings average 29–31 days on market vs 52 days unstaged Source: Industry surveys
Agents consistently report staged homes spending less time on market Source: NAR — this is the finding that holds up across multiple survey years
Assessment
The direction is well supported. NAR's broad agent surveys consistently show staged properties selling faster, which is independent of the staging industry's own reporting.
The specific 73% figure should be treated as directional rather than precise. Its original methodology isn't clearly documented.
Reasonable interpretation: staging meaningfully reduces time on market, likely in the range of 15–20 days on average, with wide variation by market conditions.
Price Effects
The Most Reliable Figure
29% of agents observed price increases of 1–10% from staging Source: NAR 2025, surveying 49,806 agents
Read this carefully. It says:
- Less than a third of agents observed any increase
- Where increases were observed, the range topped out at 10%
- The majority of agents did not report a price effect
This is the most credible price data available, and it's considerably more modest than industry claims.
The Industry Figures
85% of staged homes sold for 5–23% above list price Source: RESA Q1 2025 — stager trade body surveying its own members
Properties in the $750K–$1.49M range showed premiums around 9–10% above list Source: RESA
Average staging spend $3,813 with average ROI of 3,551% Source: RESA Q3 2025
Assessment
The gap between NAR's 29%-of-agents-saw-1-to-10% and RESA's 85%-sold-5-to-23%-above-list is substantial.
Both can be technically accurate while measuring different things — RESA's sample is properties professionally staged by their members, likely skewing toward higher-value properties in stronger markets with more marketing spend overall.
Reasonable interpretation: staging may produce a modest price premium, likely in the low single digits on average, with considerable variation. Large premiums are possible but not typical.
Online Engagement
The Figures
Staged listings see approximately 90% higher click-through rates (3.5–4.5% vs 1.8–2.2%) Source: Industry data
Viewers spend 70% more time on staged listing pages (45–60 seconds vs 27 seconds) Source: Industry data
96% of homebuyers start their property search online Source: NAR
Assessment
These are the most mechanically plausible claims in staging research. Better photos get more clicks — this requires no complex causal chain.
The specific percentages come from industry sources, but the direction is consistent with how any visual marketing performs.
Reasonable interpretation: high confidence in the direction, moderate confidence in the magnitude.
Buyer Perception
The Figures
81% of buyers say staging helps them imagine a property as their future home Source: NAR
49% of buyer's agents rate virtual staging as equal to or better than traditional staging Source: HomeLight 2025
Buyers spend more time viewing staged listing photos than unstaged ones Source: Multiple, consistent across sources
Assessment
Self-reported perception data is inherently soft — people aren't always accurate about what influences them. But the direction is consistent across sources and matches observed behaviour data.
The HomeLight figure on virtual versus physical staging is notable: nearly half of buyer's agents now consider virtual staging at least equivalent.
Try DecoAI Free
3 free credits. No credit card needed. Stage any room in 30 seconds.
Get 3 Free CreditsCost Benchmarks
Physical Staging
| Component | Cost |
|---|---|
| Consultation | $300–$600 one-time |
| Furniture rental | $500–$3,000 per month |
| Setup and removal | $500–$1,000 |
| Typical total | $2,300–$3,200 |
Source: Industry averages, US market
Average staging spend: $3,813 in Q3 2025 (RESA)
Luxury property staging: $5,000–$15,000 over three months
Virtual Staging
| Method | Cost per image |
|---|---|
| AI pay-per-image | $0.10–$3 |
| AI subscription | $12–$29/month |
| Human designer service | $16–$49 |
Source: Published vendor pricing, verified 2026
Vendor pricing is one area where the data is straightforward — these are published rates, not survey estimates.
Adoption Trends
The Figures
Physical staging fell from 37% of agents in 2017 to 21% in 2025 Source: NAR
Virtual staging adoption has grown substantially over the same period Source: Industry, specific figures vary widely
Assessment
The NAR decline in physical staging is well documented and comes from their broad agent survey.
The corresponding rise in virtual staging is harder to quantify reliably — vendors report their own growth, which doesn't aggregate into a credible market figure.
Reasonable interpretation: physical staging is declining measurably. Virtual staging is growing, though by how much isn't reliably established.
Carrying Costs
The Figures
Every 15 days saved avoids approximately $1,050–$1,950 in carrying costs Source: Derived from typical monthly costs — mortgage, insurance, utilities, taxes
This one is calculable rather than surveyed, which makes it more reliable than most staging statistics.
How to Calculate for a Specific Property
Monthly carrying cost = mortgage payment + insurance + utilities + property tax
Cost per day = monthly cost ÷ 30
Saving from staging = days saved × cost per day
For a property with $2,400 monthly carrying costs, each day saved is worth $80.
What the Data Doesn't Show
Worth being explicit about the gaps.
No Clean Comparison of Virtual vs Physical
Most staging research predates widespread AI staging. Studies comparing the two methods directly, with controlled variables, largely don't exist.
The HomeLight figure on agent perception is the closest available, and it's perception rather than outcome data.
No Isolation of Staging's Effect
Price, location, market conditions, timing, and marketing spend all affect outcomes more than staging does. No study isolates staging as a variable in a way that would satisfy a statistician.
Limited Data Outside the US
Most staging research is American. UK, European, Indian, and Australian markets have far less published data, and US figures may not transfer.
Nothing on Style Effectiveness
No credible research compares whether Modern staging outperforms Traditional in specific markets. That's all practitioner judgment.
Summary Table
| Claim | Source quality | Confidence |
|---|---|---|
| Staged sells faster | NAR + industry | High |
| Higher click-through rates | Industry | High (direction) |
| Modest price premium (1–10%, minority of agents) | NAR 2025 | Moderate |
| Large price premium (5–23%) | RESA | Low |
| Physical staging $2,300–$3,200 | Industry averages | High |
| Virtual staging $0.10–$49/image | Published pricing | High |
| Physical staging adoption declining | NAR | High |
| Specific ROI percentages | Vendor marketing | Low |
Frequently Asked Questions
Do staged homes really sell 73% faster?
The direction is well supported — staged properties sell faster. The specific 73% figure is widely cited but its original methodology isn't clearly documented. Treat it as directional.
How much more do staged homes sell for?
NAR 2025 found 29% of agents observed increases of 1–10%. Industry sources claim larger premiums, but those come from organizations selling staging.
Is staging data reliable?
Mixed. NAR data is the most reliable — large sample, broad survey, no direct incentive. Trade body and vendor data should be weighted accordingly.
What's the most credible staging statistic?
NAR's finding that 29% of agents observed 1–10% price increases. Large sample, independent source, appropriately modest claim.
How much does home staging cost?
Physical: $2,300–$3,200 per property in the US. Virtual: $0.10–$3 per image with AI tools, $16–$49 with human designers.
Is physical staging declining?
Yes, measurably. NAR data shows a fall from 37% of agents in 2017 to 21% in 2025.
Does virtual staging work as well as physical?
No controlled comparison exists. HomeLight 2025 found 49% of buyer's agents rate virtual as equal to or better than traditional — but that's perception, not outcome data.
Where can I find independent staging research?
NAR's annual Profile of Home Staging is the most credible publicly available source. Most other data comes from organizations with a commercial interest in staging.
The Honest Summary
Well supported: Staging reduces time on market and increases online engagement. Physical staging costs $2,300–$3,200 and its adoption is declining.
Moderately supported: Staging may produce a modest price premium, most credibly in the 1–10% range observed by a minority of agents.
Poorly supported: Large price premiums, precise ROI percentages, and most specific figures circulating in staging marketing.
Not established: Whether virtual staging performs equivalently to physical in outcome terms, and whether style choice affects results.
Test it yourself. DecoAI gives 3 free credits with no card required. Comparing first-week views on your own staged and unstaged listings produces better data than any industry survey.